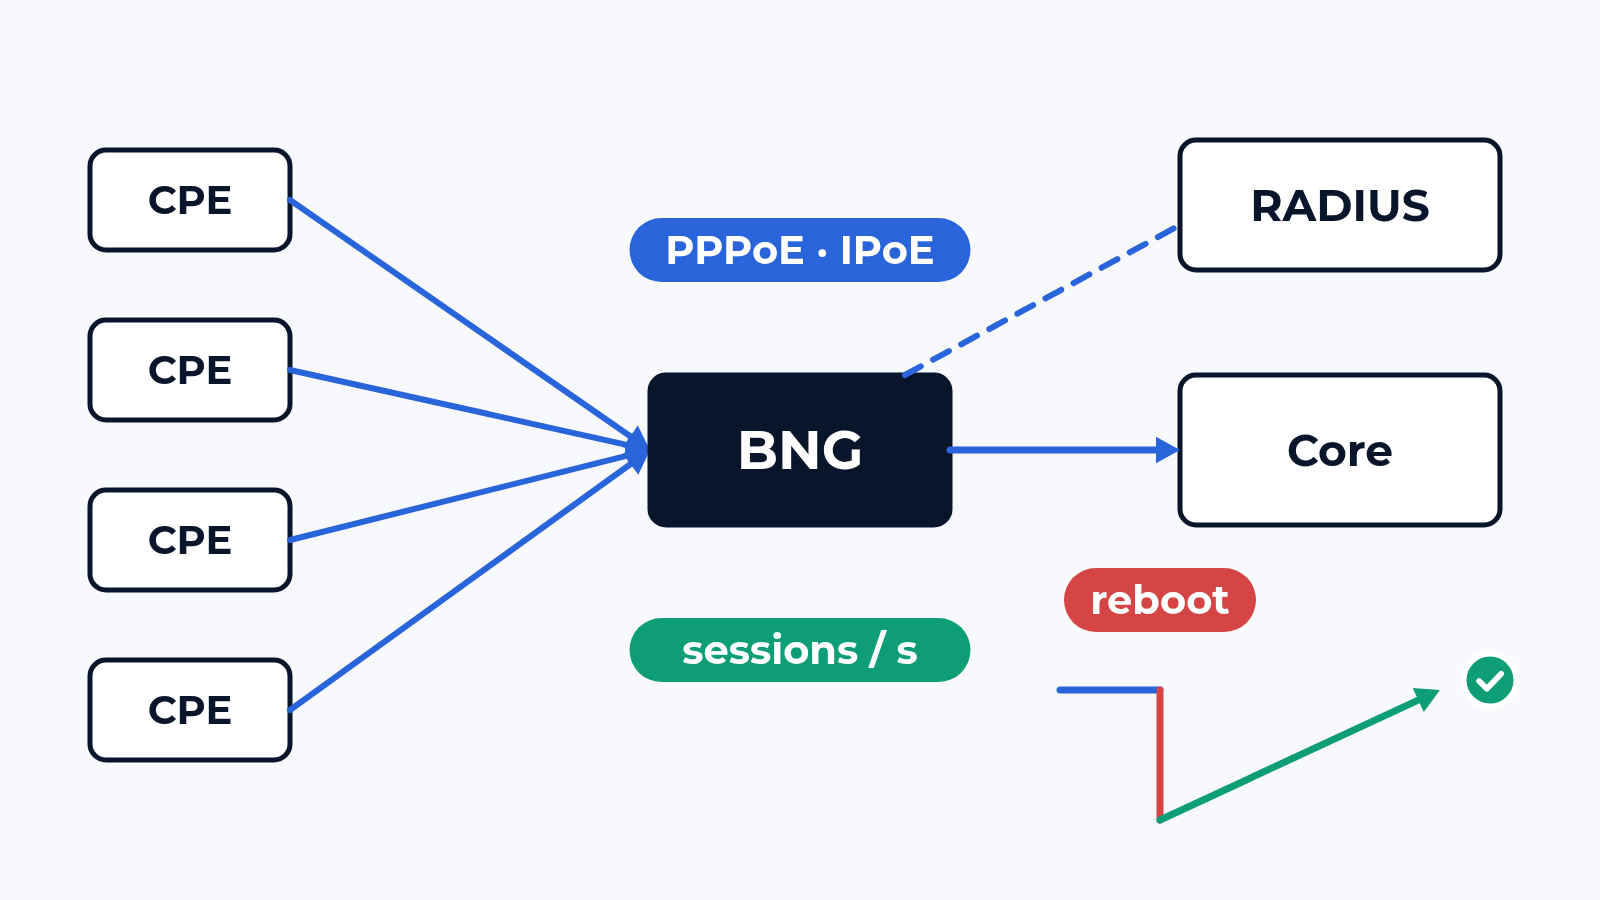
A BNG datasheet gives a subscriber count, for example 64,000 sessions per chassis. That figure comes from an idle box, sessions brought up slowly, users in a local list. After a power cut in your network every CPE in town logs in at once, RADIUS sits in another data centre and half the homes run dual stack. We measure how many sessions per second the box sets up, how many it holds with traffic in each of them and how many minutes it needs to bring everyone back after a reboot.
The bench
The BNG or BRAS goes onto the CloudLAB bench like any edge router; a virtual BNG runs on the bench hypervisor or in your tenant. On the access side the generator emulates subscribers behind access nodes: PPPoE clients with PAP or CHAP, IPoE clients on DHCPv4 and DHCPv6, one C-VLAN per subscriber inside an S-VLAN per access node, or the VLAN plan you run. Once a session is up, each subscriber sends and receives the traffic of its plan. On the network side it plays the upstream routers and servers, on 1G, 10G or 100G ports (400G and faster per project).
Logins go to your RADIUS server or to an emulated one, with the attributes your BNG expects: plan, address pool, QoS profile, session timeout. The subscriber count, the plan mix and the login pattern per hour come from your statistics and the dimensioning.
What we check
- Setup rate: PPPoE and IPoE sessions per second, raised step by step until logins fail; for PPPoE the time from PADI to IPCP up, for IPoE from DHCP Discover to Ack
- Session ceiling: the ramp stays below the rate measured above, so the count itself is what breaks; every session carries traffic, and the full count is held for hours
- RADIUS: Access-Request rate and response time as the BNG sees them, timeouts, retries, failover to the second server, CoA to change a plan mid-session
- Accounting: Start, Stop and Interim records counted against the sessions, second by second, during the ramp and after it
- Per-subscriber shaping: the plan rate in both directions with all subscribers active, H-QoS with the subscriber queue inside the port or access-node shaper, voice ahead of downloads within one home
- Dual stack: IPv6CP with DHCPv6 prefix delegation on PPPoE, DHCPv4 next to DHCPv6 on IPoE, the same policy and shaper on both families
- Reboot and failover: a reload, a line card pulled, a switchover to the standby card or chassis at full load; time until 50 %, 90 % and 100 % of subscribers have sessions and traffic back
- Churn: logins and logouts at a steady rate while the others carry traffic; sessions, addresses and memory back to the baseline afterwards
The queue mechanics are in our QoS post, and the RADIUS server on its own is a separate test.
What usually breaks
The storm after a reload. A typical acceptance: a BNG with 30,000 PPPoE subscribers on the bench (an example) reloads under load. Every CPE sends PADI within seconds, the BNG fires Access-Requests faster than RADIUS answers, requests time out, CPEs retry and the retries add to the load. All subscribers are back after 18 minutes against 5 in the design. A PADI rate limit per access port and a longer RADIUS timeout bring it to 4 minutes. Without the test, the first measurement would have been the helpdesk queue.
Accounting that falls behind. Logins succeed and traffic flows, while Interim records pile up on the BNG during the storm and some Start records never leave the queue. The subscriber is online and billing does not know. We count records against sessions per second, so the gap shows up as a number.
The IPv6 half. In a typical project a 100 Mbit/s plan held at 100 on IPv4 alone and delivered 190 with both families together: the IPv6 sessions picked up a policy from another template. A test with traffic on one family at a time never shows it.
What is in the report
Setup rate per access type and per stack, with the step where logins started to fail. The session ceiling with traffic on and what ran out first: memory, address pools, RADIUS or control-plane CPU. Recovery curves after every reload and failover, subscribers back per second. RADIUS response time and accounting records against sessions. Delivered rate per plan. The BNG config, RADIUS attributes and subscriber profiles, so the run repeats on the next release; a rerun on a known setup takes 3 business days.
Where to start
Send us the BNG model and release, the subscriber count with the plan mix and the RADIUS attribute list. We answer with a draft test plan: the items, the bench layout and the dates. The report is yours to keep and to show to the vendor. Write to us or look at what else the bench does.
 Alexander Zemskov
5 min read
 Alexander Zemskov
5 min read