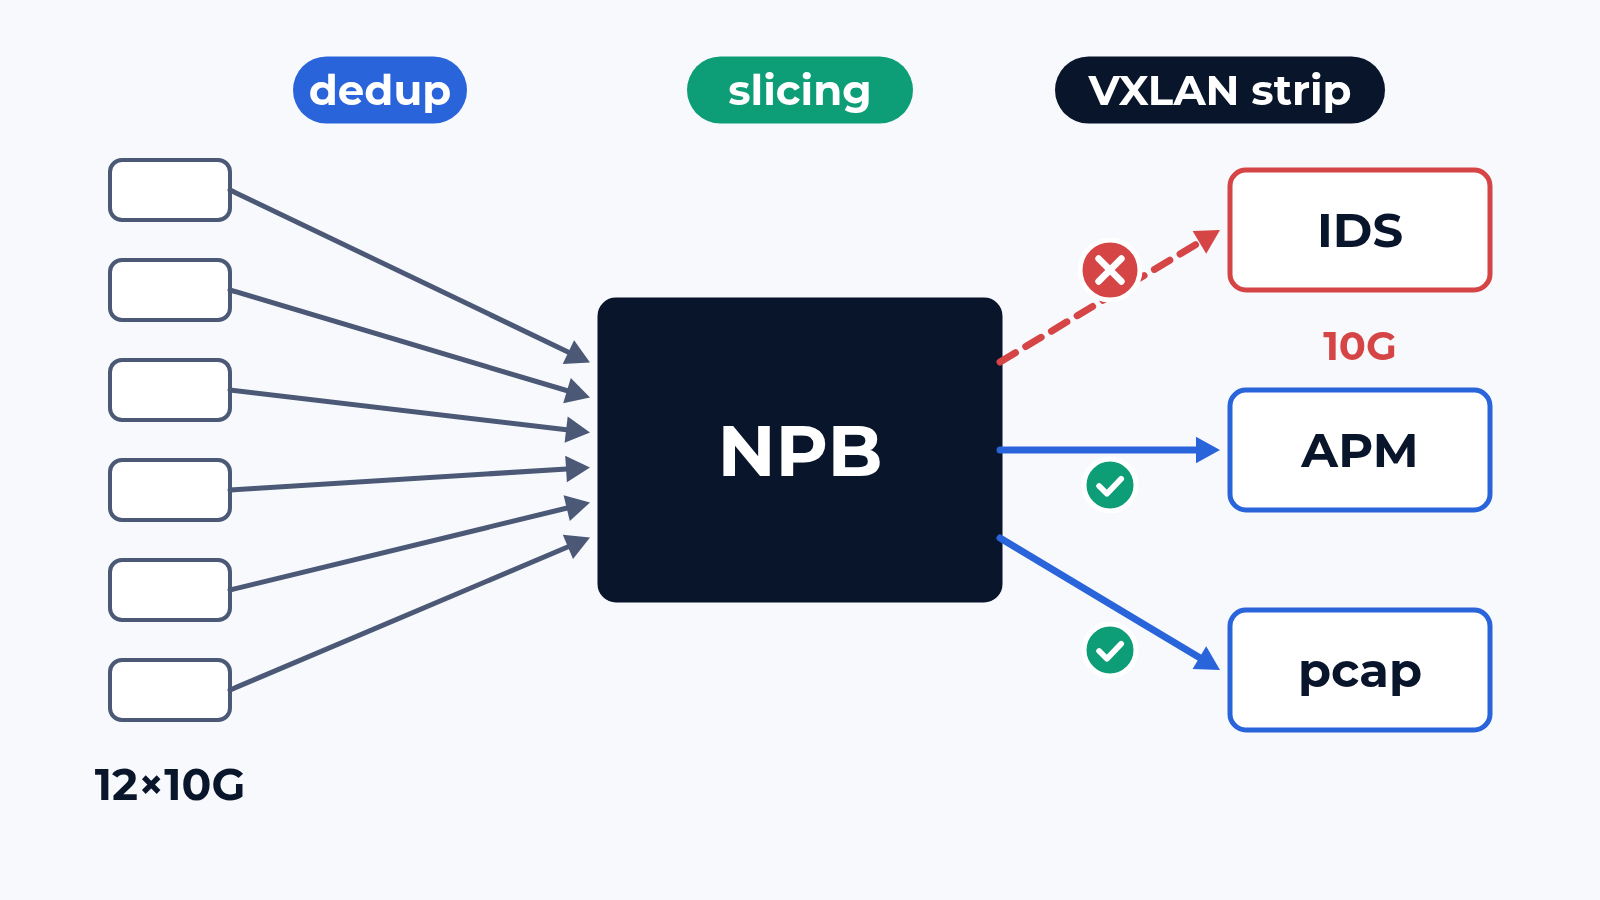
A packet broker datasheet lists line rate on every port, deduplication, packet slicing, tunnel stripping and a few thousand filter rules. Each line holds when the feature is tested alone. The security team counts on more: the IDS, the recorder and the APM probe see every packet once and intact. Load the full rule table, switch on 3 features, feed 12 network ports into one tool port, and the broker starts to decide what to drop. We measure what reaches each tool, packet by packet, against what entered the broker.
The bench
The broker goes onto the CloudLAB bench with 1G, 10G or 100G ports (400G per project). Generator ports sit on both sides: on the network side they replace the TAPs and SPAN sessions, on the tool side they stand in for the IDS, the recorder and the probes. Every packet a tool would get is counted, compared byte by byte and timestamped. Brokers do capture duty at 10G and 100G in our own lab too, and their drop counters rarely tell the whole story, so on the bench the generator counts both ends.
The traffic follows your network: the mix from your NetFlow export or capture, VLAN and Q-in-Q tags, VXLAN, MPLS label stacks and GRE where your links carry them, IPv4 and IPv6. Duplicates are built in on purpose, with the offset your SPAN points produce, from microseconds to milliseconds. The configuration is your filter map with its real rule count, tool groups and feature chain.
What we check
- Filtering at a full table: your rule count, L2 to L4, IPv4 and IPv6, line rate per frame size by RFC 2544 binary search; each tool port gets every packet its rules match and nothing else
- Deduplication: the share of duplicates removed against the window setting, copies that arrive later than the window, originals removed by mistake, TCP retransmissions included
- Packet slicing: the slice length kept exactly, a valid FCS on the cut frame, the original length preserved where the tool needs it
- Header stripping: VXLAN, GRE, MPLS stacks of 1 to 3 labels and deeper, VLAN tags; the inner packet intact, and where an unknown encapsulation ends up
- Load balancing to tools: both directions of a session on the same tool, the spread across a tool group, one tool going down and how many sessions end up split
- Timestamps: the broker's stamp against the generator's send time per packet, offset and spread; if the broker takes time from PTP, the generator emulates the source, and a full time error analysis is agreed per project
- Aggregation: many network ports into one tool port at an average below line rate, with microbursts; loss per burst length and the buffer depth it reveals
- Rule changes under load: a rule added or removed while traffic runs, the gap on untouched rules, the time until the new rule takes effect
What usually breaks
Features stacked. In a typical project the broker deduplicates at 10G line rate while dedup is the only feature on the port. With VXLAN stripping in front of it and the full rule table loaded, the same module passes 6.2 Gbit/s of 128-byte packets and then drops. The datasheet gives both features at line rate, in separate lines.
The tool port. 12 network ports of 10G feed one 10G IDS port at 55% average load. The broker's per-minute counter shows 0.02% drops. The generator counts 4% of the packets inside each burst lost, always at the start of the busiest second, exactly when a recording matters most. Nobody notices the holes until the day the capture is needed. The buffer mechanics are those of a switch, see how we test Ethernet switches.
The rule commit. One new filter in a table of 2,000 recompiles the whole table, and every tool port loses traffic for 180 ms, rules nobody touched included. Once a week that goes unnoticed. With automation pushing changes every few minutes it becomes a steady gap in the evidence.
What is in the report
Per tool port: packets expected, delivered, lost, duplicated and altered, per feature combination and frame size, next to the datasheet figure. Dedup against the window setting, loss per burst length for each aggregation ratio, the hash spread and split sessions, timestamp offset and spread, the gap at every rule commit. The configuration export, raw counters per trial and captures of the seconds where packets went missing. For a shortlist: one table for all candidates and a test plan for the tender annex.
Where to start
Send us the broker models, the filter map and the list of tools behind it. We answer with a draft test plan: the items, the bench layout and the dates. The report is yours to keep and to show to the vendor. Write to us or look at what else the bench does.
 Alexander Zemskov
5 min read
 Alexander Zemskov
5 min read