
In this article
Wi-Fi used to be the network you tolerated. Now it carries the video call with the customer, the telehealth session, the factory floor and the classroom. This post is about what changes when Wi-Fi becomes critical: why the tests most teams run do not predict anything, what a repeatable test looks like, and the specific techniques that produce numbers you can put in front of procurement.
There are more than 14 billion Wi-Fi devices in use and the industry shipped close to 4 billion more last year (IDC). The number that matters is not the count. It is what those devices are now expected to do: real-time video, voice, remote diagnostics, industrial control. Ten years ago a bad Wi-Fi day meant slow email. Today it means a dropped consultation, a stalled production line, a truck roll, in some cases a safety incident. The cost of letting an undiagnosed product issue reach the field has gone up by an order of magnitude, and the way most Wi-Fi gets tested has not moved at all.
Two numbers, and they fight each other
Strip Wi-Fi performance down and you are measuring two things: how fast the link is (rate) and how far it reaches (range). They are not independent. The best rate happens next to the access point; the best range delivers the worst rate. Everything else, from roaming to airtime fairness to latency under load, is a variation on how the device manages that trade-off with many clients competing for the same air.
This is why the vendor's headline number is close to meaningless on its own. Wi-Fi 7 advertises a theoretical 46 Gbps. Wi-Fi 6 gets to 9.6 Gbps on paper. Those figures describe the modulation, not a device, not a room and not a client mix. The question a buyer needs answered is different: at the distance, the wall count and the client density I actually have, what rate does this access point sustain, and how does it degrade as conditions get worse?
Why a walk test is not a test
The intuitive way to answer that question is a rate-versus-range (RvR) test: measure throughput at increasing distance until the link gives up. Most teams do exactly that with a laptop and a floor plan. Then they get different numbers the next day, from the same access point, in the same building.
The reason is the list of things that move Wi-Fi signal strength without anyone touching the equipment:
- Neighbouring networks and everything else that radiates in 2.4, 5 and 6 GHz
- Walls, furniture, people, and where the antennas happen to point
- Reflections and multipath, which change when a door opens
- Atmospheric conditions, hour to hour
Signal strength is measured in dBm because it falls off with the square of distance: the signal at two metres is a quarter of the signal at one metre, and at eight metres it is under 2 percent. On that scale, a few dB of uncontrolled interference is the difference between a "great" result and a "poor" one. A walk test does not control any of it. It is not a bad test. It is not a test at all, because a measurement you cannot repeat is not a measurement.
The same logic applies to the large anechoic chamber and the outdoor antenna range. They remove interference, and they are expensive, shared, and booked. In practice the team that needs to qualify an access point this month does not get chamber time this month.
Three things you are actually testing
Wi-Fi testing answers three questions, and buyers tend to confuse them.
Conformance. Does the device implement the standard? The Wi-Fi Alliance certification programs cover this. A certified logo tells you the device speaks the protocol correctly. It tells you nothing about how well.
Interoperability. Does it work with other people's equipment: the phones, laptops and IoT devices your users bring? Also largely covered by certification, and also silent on performance.
Performance. Is it fast enough, far enough, stable enough, for the number of clients and the traffic you will put on it? This is where procurement money is won and lost, and it is the one question certification does not answer. The industry reference here is the Broadband Forum's TR-398, "Wi-Fi In-Premises Performance Testing", now at Issue 4 with Wi-Fi 7 coverage. More on it below.
Packet blasting tells you about the radio, not the user
Readers of our security series will recognise this argument. Wi-Fi has its own version of the PCAP-replay problem.
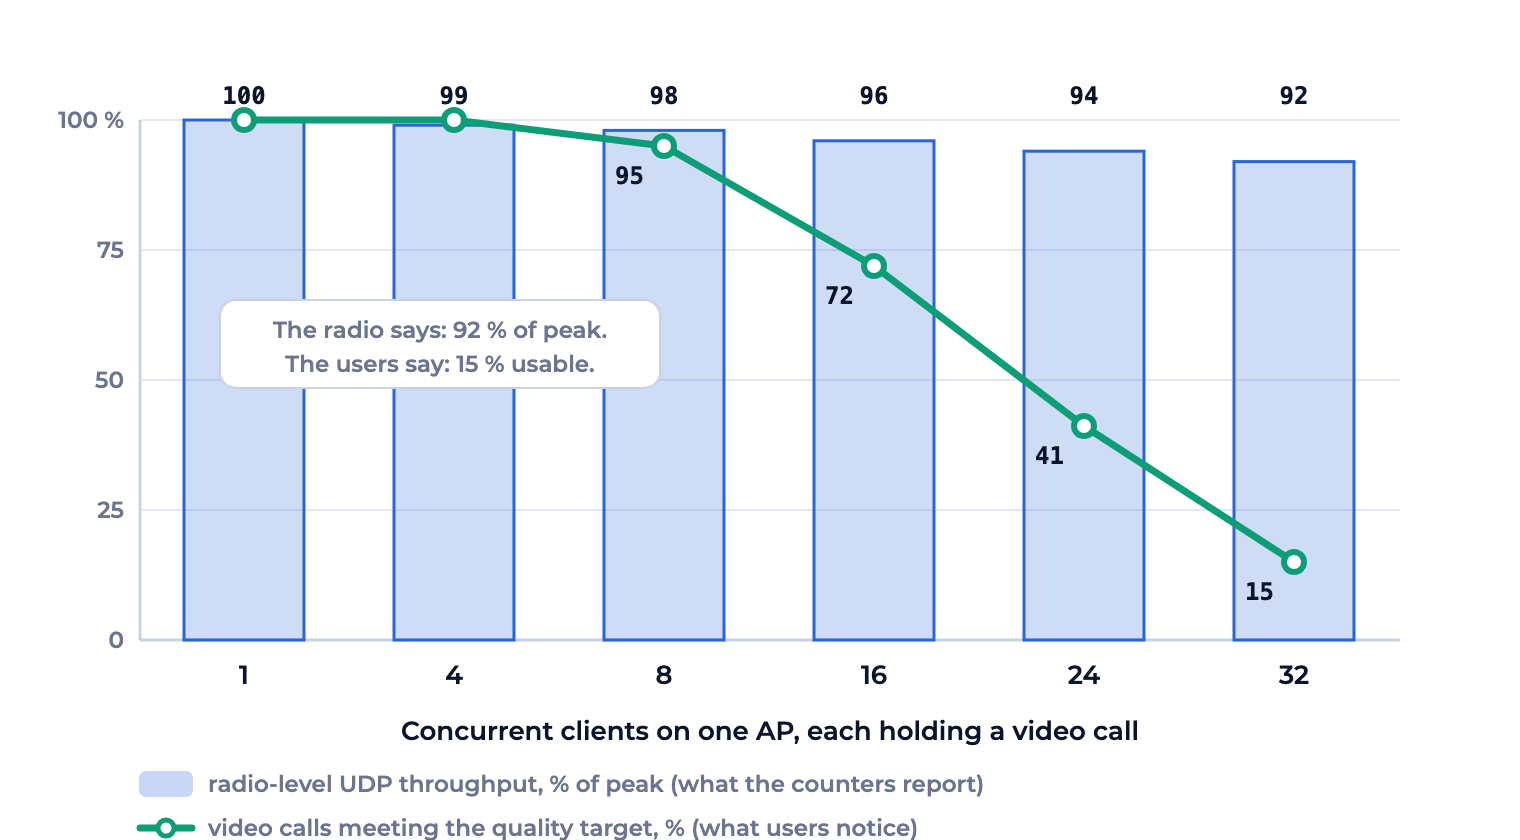
Stateless traffic, a stream of Layer 2/3 packets, is cheap to generate and useful for one thing: characterising the raw link. Throughput, loss, jitter, latency under a simple load. It says nothing about what a user experiences, because users do not send UDP floods. They open TCP sessions, negotiate TLS, fetch HTTP objects, hold a video call.
Stateful traffic, Layers 2 through 7, is what exposes the behaviour that matters: sessions that stall when a client roams, application throughput collapsing while the radio counters still look fine, voice quality falling apart under a dozen concurrent video streams. It is more expensive to generate and it is the only kind that measures the thing you are buying the access point for. A Wi-Fi test plan that reports only packet-level throughput is the wireless equivalent of a firewall datasheet: technically true, practically misleading.
Emulate the room instead of walking it
The fix for the walk test is to bring the variables under control and then vary them on purpose. That is channel emulation, and there are two ways to do it.
Conducted, cable and attenuator based. The access point and the emulated clients sit in RF-isolated enclosures; their antennas are connected through programmable attenuators. Adding attenuation emulates distance. Sweep it and you get a clean, repeatable rate-versus-range curve in minutes, not days. It works across every band from Wi-Fi 4 to Wi-Fi 7, it is affordable, and it covers the standard indoor channel models well. Its limit: it does not model every aspect of multipath fading for mobility scenarios, and as access points grow to 8x8 antenna arrays, the cabling gets awkward.
Real-time DSP channel emulation. A digital emulator that models entire environments, from a large office to outdoor-to-indoor to airborne, with full multipath and mobility behaviour and all the IEEE channel models. Far more capable, far more expensive, and more complex to configure. Justified for chipset and module vendors; overkill for qualifying an access point for a bank branch.
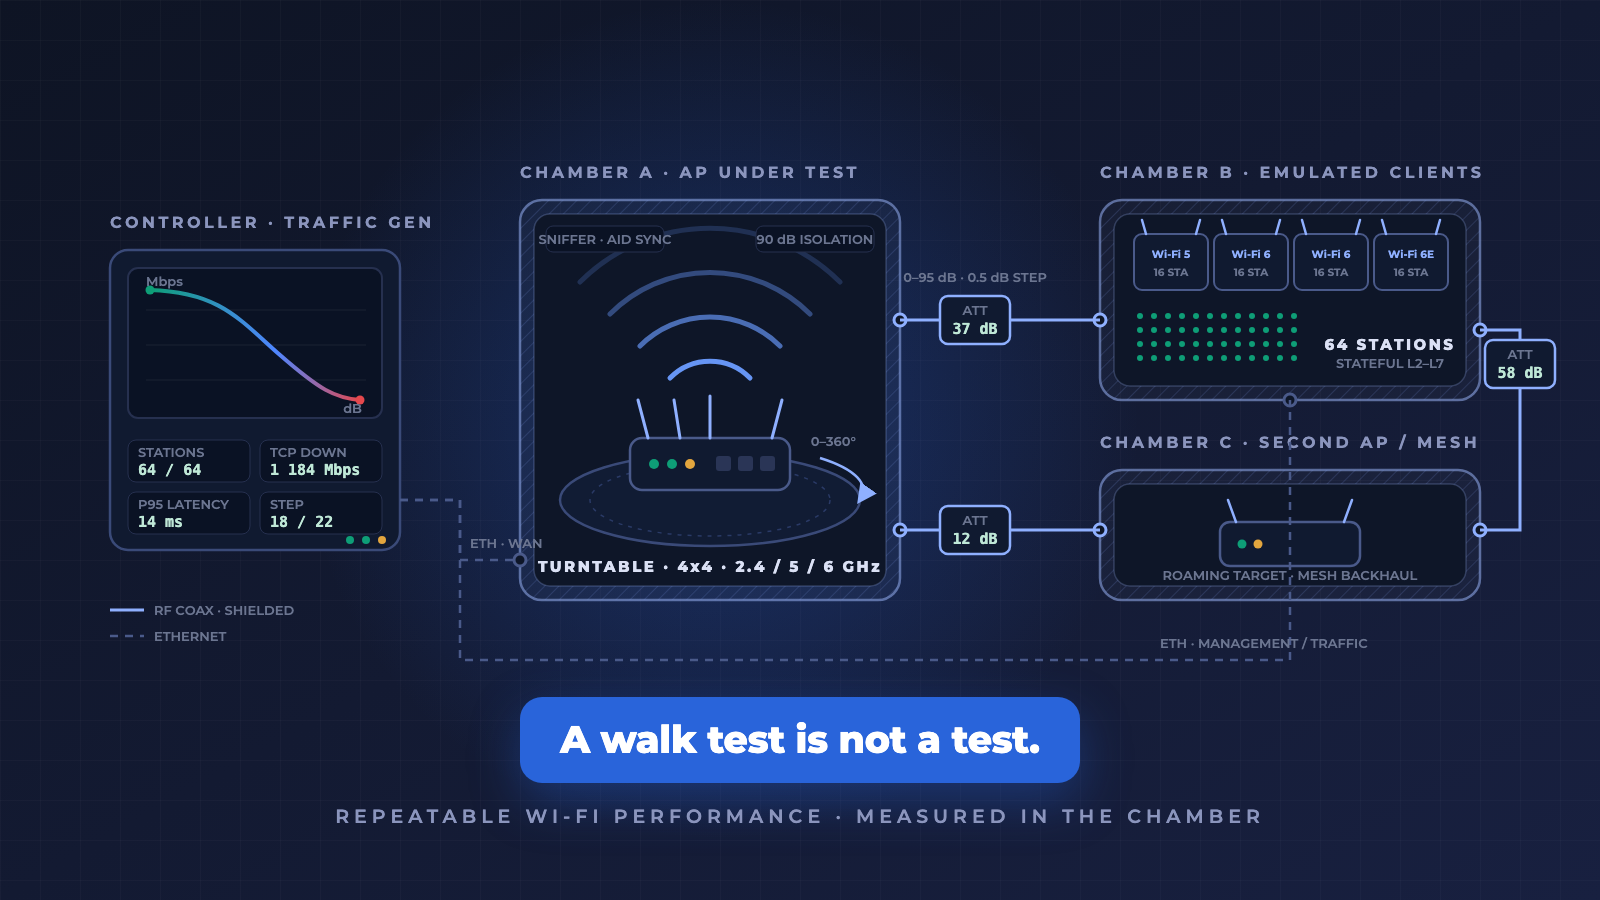
The approach that has changed the economics is the personal testbed, and it is what the diagram at the top of this post shows: several small RF chambers, each holding an access point, a mesh node or a bank of emulated stations, wired to each other through programmable attenuators and, where orientation matters, mounted on a turntable. Isolation of 70 to 90 dB keeps the neighbours out. The chambers become rooms; the attenuators become walls and distance; the turntable is the user who put the router behind the TV. A test that used to take weeks of walking takes hours, and it produces the same number tomorrow.
One practical note for Wi-Fi 6 and later: the old trick of watching everything with a sniffer in monitor mode no longer works. OFDMA and MU-MIMO address frames to specific association IDs, so a passive sniffer sees fragments. A proper testbed synchronises capture with the emulated stations so you still get the full picture while the test runs.
Seven techniques, and the numbers they produce
"Chamber and attenuators" is the equipment. The value is in the procedures you run on it. These are the ones that separate access points that look alike on paper. The numbers in this section are illustrative, chosen to show the shape of a result rather than to describe any specific product.
1. Rate-versus-range sweep
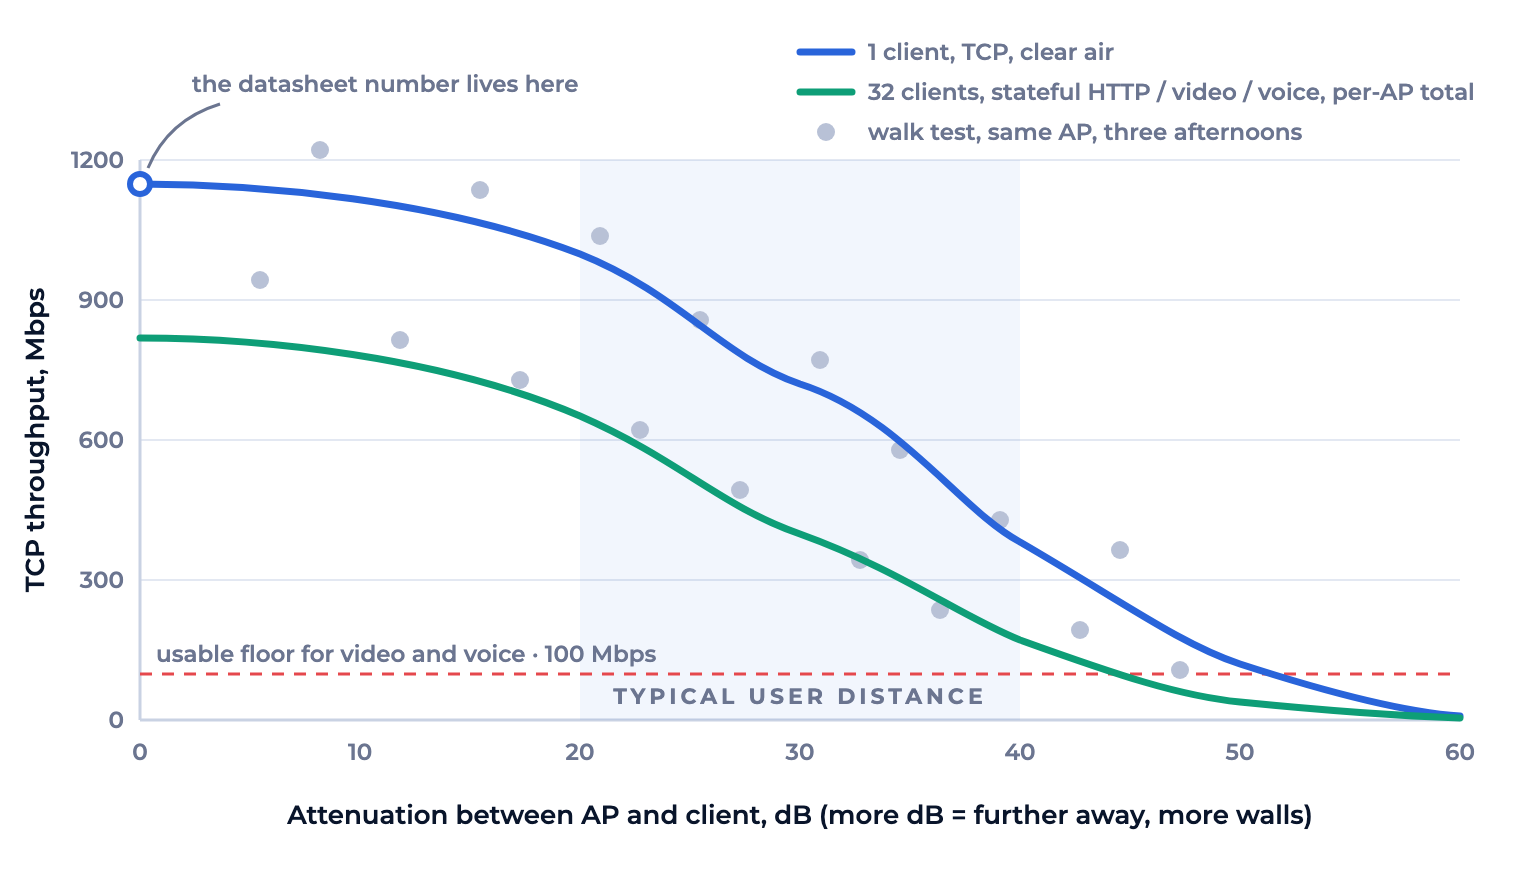
Fix the client mix, then step attenuation from 0 to about 60 dB in 3 dB increments, holding each step long enough for TCP to settle. Run it downlink and uplink, per band, and with both a 2x2 and a 1x1 client, because the phone in your user's pocket is 2x2 at best. The output is the curve in the first chart, and the number that matters is not the peak. It is where the curve crosses your usable floor, and how steeply.
| Attenuation | AP A, TCP down | AP B, TCP down | What it stands for |
|---|---|---|---|
| 0 dB | 1 150 Mbps | 1 180 Mbps | same room, line of sight |
| 20 dB | 1 000 Mbps | 910 Mbps | next room |
| 40 dB | 380 Mbps | 190 Mbps | two walls, end of the corridor |
| 50 dB | 120 Mbps | 35 Mbps | far bedroom, garage |
| Crosses 100 Mbps at | 52 dB | 44 dB | the number that goes in the report |
Two access points with the same headline number, and one of them loses a quarter of the floor plan. A walk test would have shown you 1 150 and 1 180 and called it a tie.
2. Spatial consistency
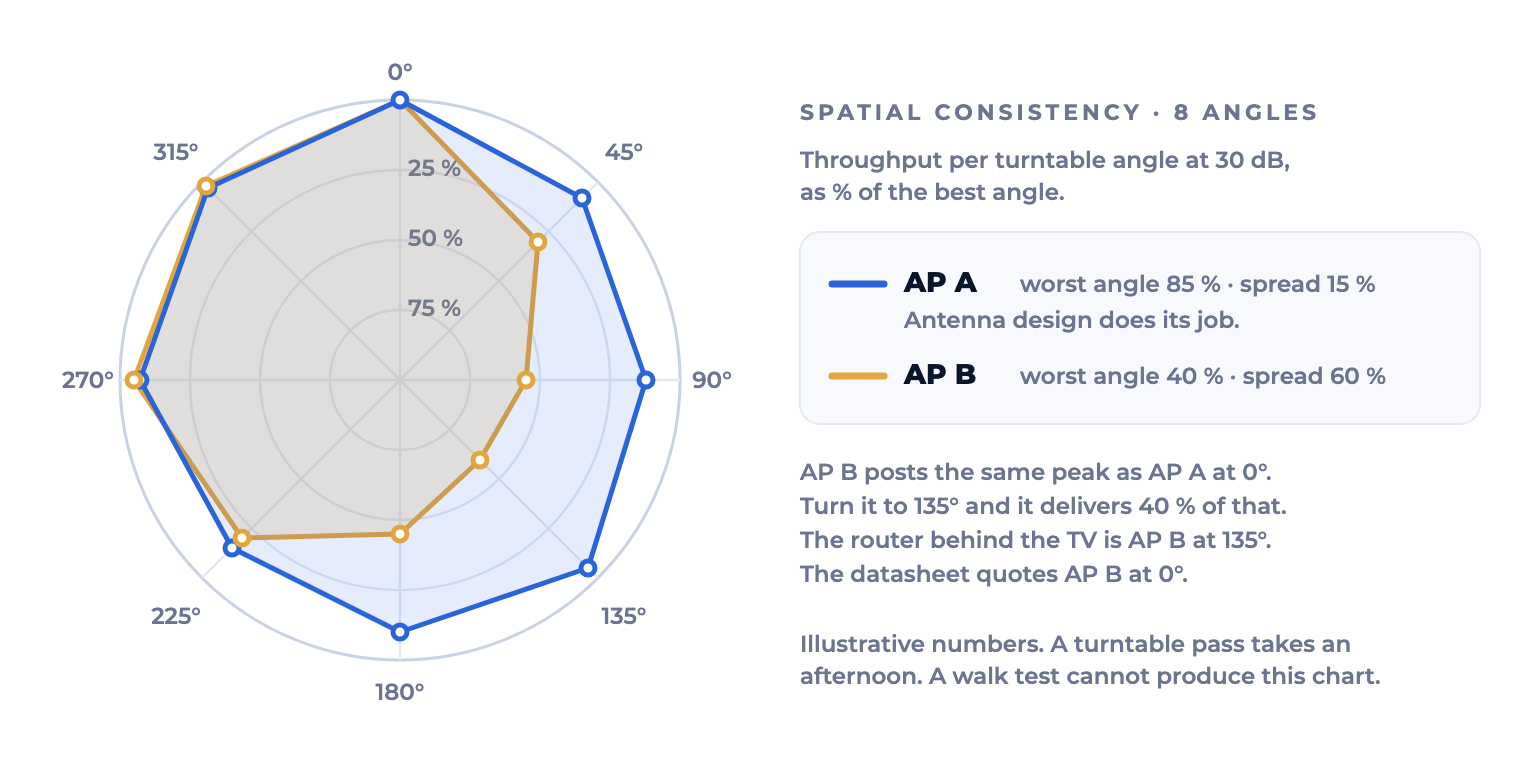
Set attenuation to a mid-range value, say 30 dB, and rotate the access point through eight orientations on the turntable, measuring throughput at each. Report the worst angle and the spread. TR-398 does this in the horizontal and the vertical plane. It is the single cheapest way to find out whether the antenna system is designed or decorated.
3. Airtime fairness
Connect one fast Wi-Fi 6 client and one slow legacy client, ideally a real 802.11n device pinned to a low rate, and load both. A well-behaved access point schedules by airtime, so the fast client keeps most of its throughput. A badly behaved one lets the slow client drag everyone down to its speed. Every office with one old barcode scanner on the Wi-Fi has this problem and does not know it.
4. Latency under load
Saturate the access point with bulk TCP from 20 or 30 stations, then measure the round-trip latency of a small, voice-like flow on one more. Report the 95th percentile, not the average. Access points that post identical throughput can differ by an order of magnitude here, and this is the number a video call actually feels. Under 50 ms at the 95th percentile with the radio saturated is a good result. Several hundred milliseconds is common and invisible in a throughput test.
5. Multi-station capacity ramp
Add stations one group at a time, with a mix of Wi-Fi 5, 6 and 6E clients, each holding stateful traffic: an HTTP session, a video stream, a voice flow. Watch per-client goodput and application-level quality, not the aggregate. The chart in the previous section is the output. The number you want is the client count at which the first application falls below its target, because that is the room size this access point can serve.
6. Roaming and mesh
Two access points in two chambers, both connected to the same station chamber through separate attenuators. Ramp one attenuator up and the other down at 1 dB per second, so from the client's point of view it walks from one room to the next. Log the moment the client moves, how long the hand-off takes and how many voice packets it loses. Repeat with 802.11k/v/r enabled and disabled, and with each client type you care about, because roaming is decided by the client, not the access point.
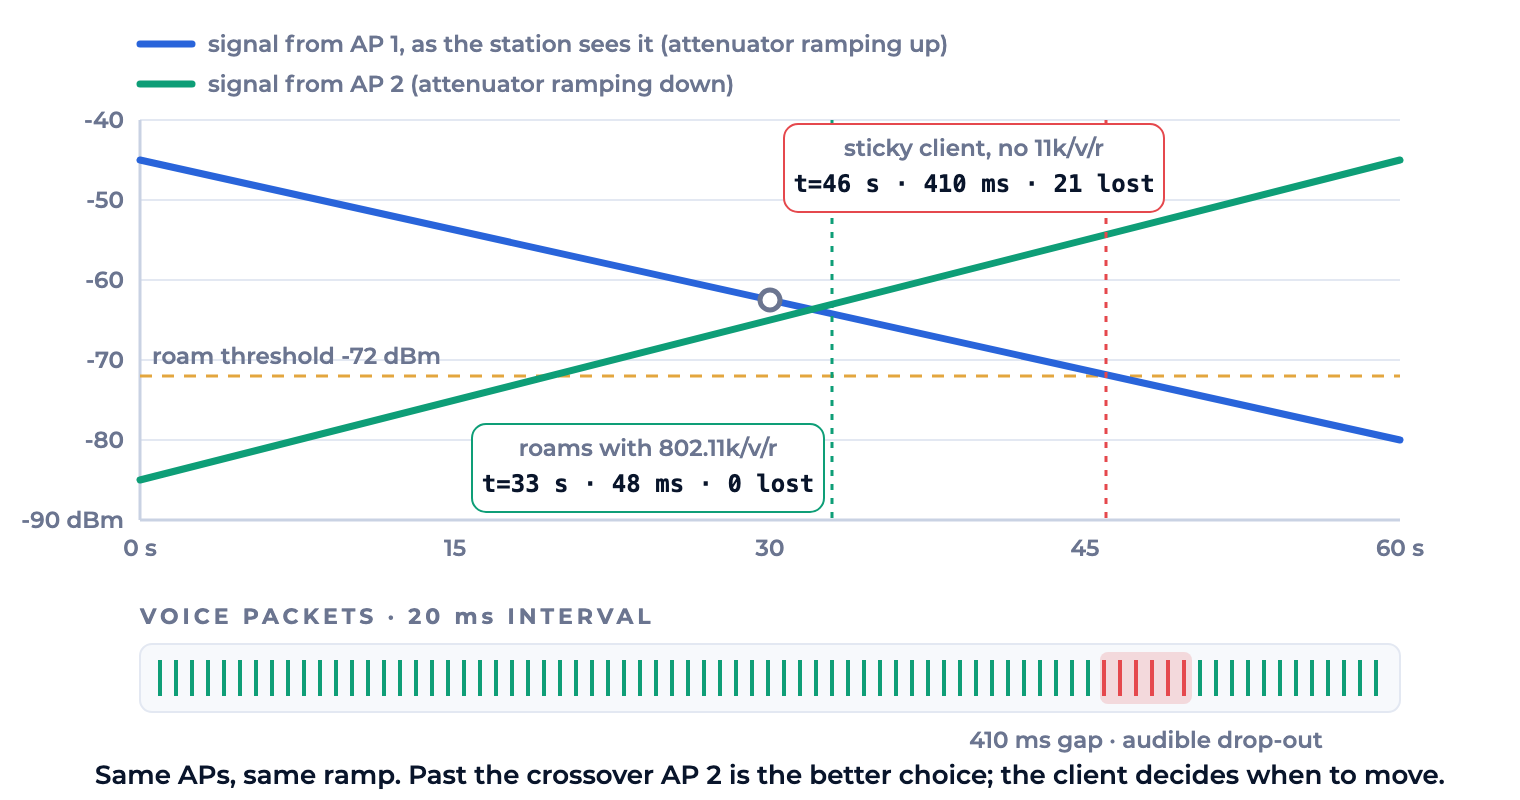
For mesh systems the same rig measures backhaul rate versus range over one and two hops. An extender that forwards every packet twice doubles its exposure to interference; clients that get "stuck" on a weak node instead of roaming are the single most common source of "the Wi-Fi is bad" tickets. Neither shows up in a single-client throughput test. Both show up here.
7. Long-term stability and coexistence
Run a moderate stateful load for 24 hours and count disconnects, throughput drift and memory-related slowdowns. Then put a second access point on the same channel in the neighbouring chamber and watch what automatic channel selection does. Products that pass everything above still fail here, usually at hour nine.
What a full test plan contains
TR-398 is useful less as a certification and more as a checklist of what "performance" actually means for an access point that will be deployed in homes and small offices. The seven techniques above map onto it directly. A full run covers, among others:
- Receiver sensitivity at different angles and encodings
- Maximum connection and throughput with 32 stations; TCP and bidirectional UDP throughput
- Airtime fairness: does one slow client drag everyone down?
- Latency under load and quality of service, the numbers a video call cares about
- Rate versus range and spatial consistency: the same AP, rotated, should not be a different AP
- Band steering, multi-band and dual-band throughput
- Multiple-station stability, downlink and uplink MU-MIMO, multicast
- Long-term stability, coexistence with a neighbouring AP, automatic channel selection
- Mesh: backhaul rate versus range over one and two hops, and mesh roaming
- Issue 4 additions for Wi-Fi 7: 6 GHz OFDMA with up to 31 stations, preamble puncturing and multi-link operation
Read that list against the typical evaluation, which is one laptop, one iPerf run, one location. The gap is the point.
What good looks like
If you are qualifying access points, a Wi-Fi 6E upgrade or a mesh system, the test that will predict production has these properties.
- RF isolation. Chambers, not the conference room. If the environment is not controlled, the result is a coincidence.
- Distance you can dial. Programmable attenuation for rate versus range, so the curve is repeatable and comparable across vendors.
- Client scale. Dozens of emulated stations per radio, with the mix of Wi-Fi 5, 6 and 6E clients your users actually carry, not one laptop.
- Stateful traffic. TCP, HTTP, video and voice, with per-application results, alongside the raw packet numbers.
- Orientation. A turntable pass. Spatial consistency separates good antenna design from a good marketing photo.
- Mesh and roaming scenarios with per-hop throughput, latency and loss, and measured roaming delay.
- Locked configuration. Firmware, channel width, power and features fixed before the first run and documented in the report. No tuning between runs.
- Automation. The whole plan scripted, so it can be re-run on the next firmware and the two reports can be compared line by line.
How we run it
Our Wi-Fi testbeds are built the way the diagram at the top shows: shielded chambers with 70 to 90 dB of isolation, programmable attenuators and turntables between them, multi-station emulation that puts dozens of stateful clients on each radio, and an automated TR-398 run that produces a pass/fail table per test case. The lab covers Wi-Fi 4 through Wi-Fi 6E on all three bands, including 6 GHz. Wi-Fi 7 capability, with multi-link operation, 320 MHz channels and preamble puncturing, is being added; if your evaluation is specifically about Wi-Fi 7, talk to us about timing before you plan it.
The tooling is the same class that access point vendors use to qualify their own products before release, which is exactly why it is useful on the buyer's side: it removes the argument about whether the test was fair.
The output is not a slide. It is a report with the locked configuration on page one, the measured curve for every scenario, the pass/fail table against the thresholds you chose, and the raw captures if your engineers want to argue with us. If two vendors are on the shortlist, they run the same plan in the same chambers on the same day.
The access point that wins that comparison is not always the one with the bigger number on the box. It is usually the one that degrades gracefully: keeps latency flat as the thirtieth client joins, hands a moving client off before the call drops, and does the same thing again tomorrow. That is the property worth paying for, and a walk test cannot see it.
TEST4NET LLC is an independent network and security testing laboratory in Yerevan. We qualify Wi-Fi access points, mesh systems and client devices in chambered, automated testbeds and hand you a report you can put in front of procurement. Contact us to discuss your Wi-Fi evaluation.
Comments